From plant data to decision

wattiot Core

The cloud platform that turns your plant's signals into KPIs, comparisons, alarms and reports. With the shift, order and batch context that makes the numbers mean something.
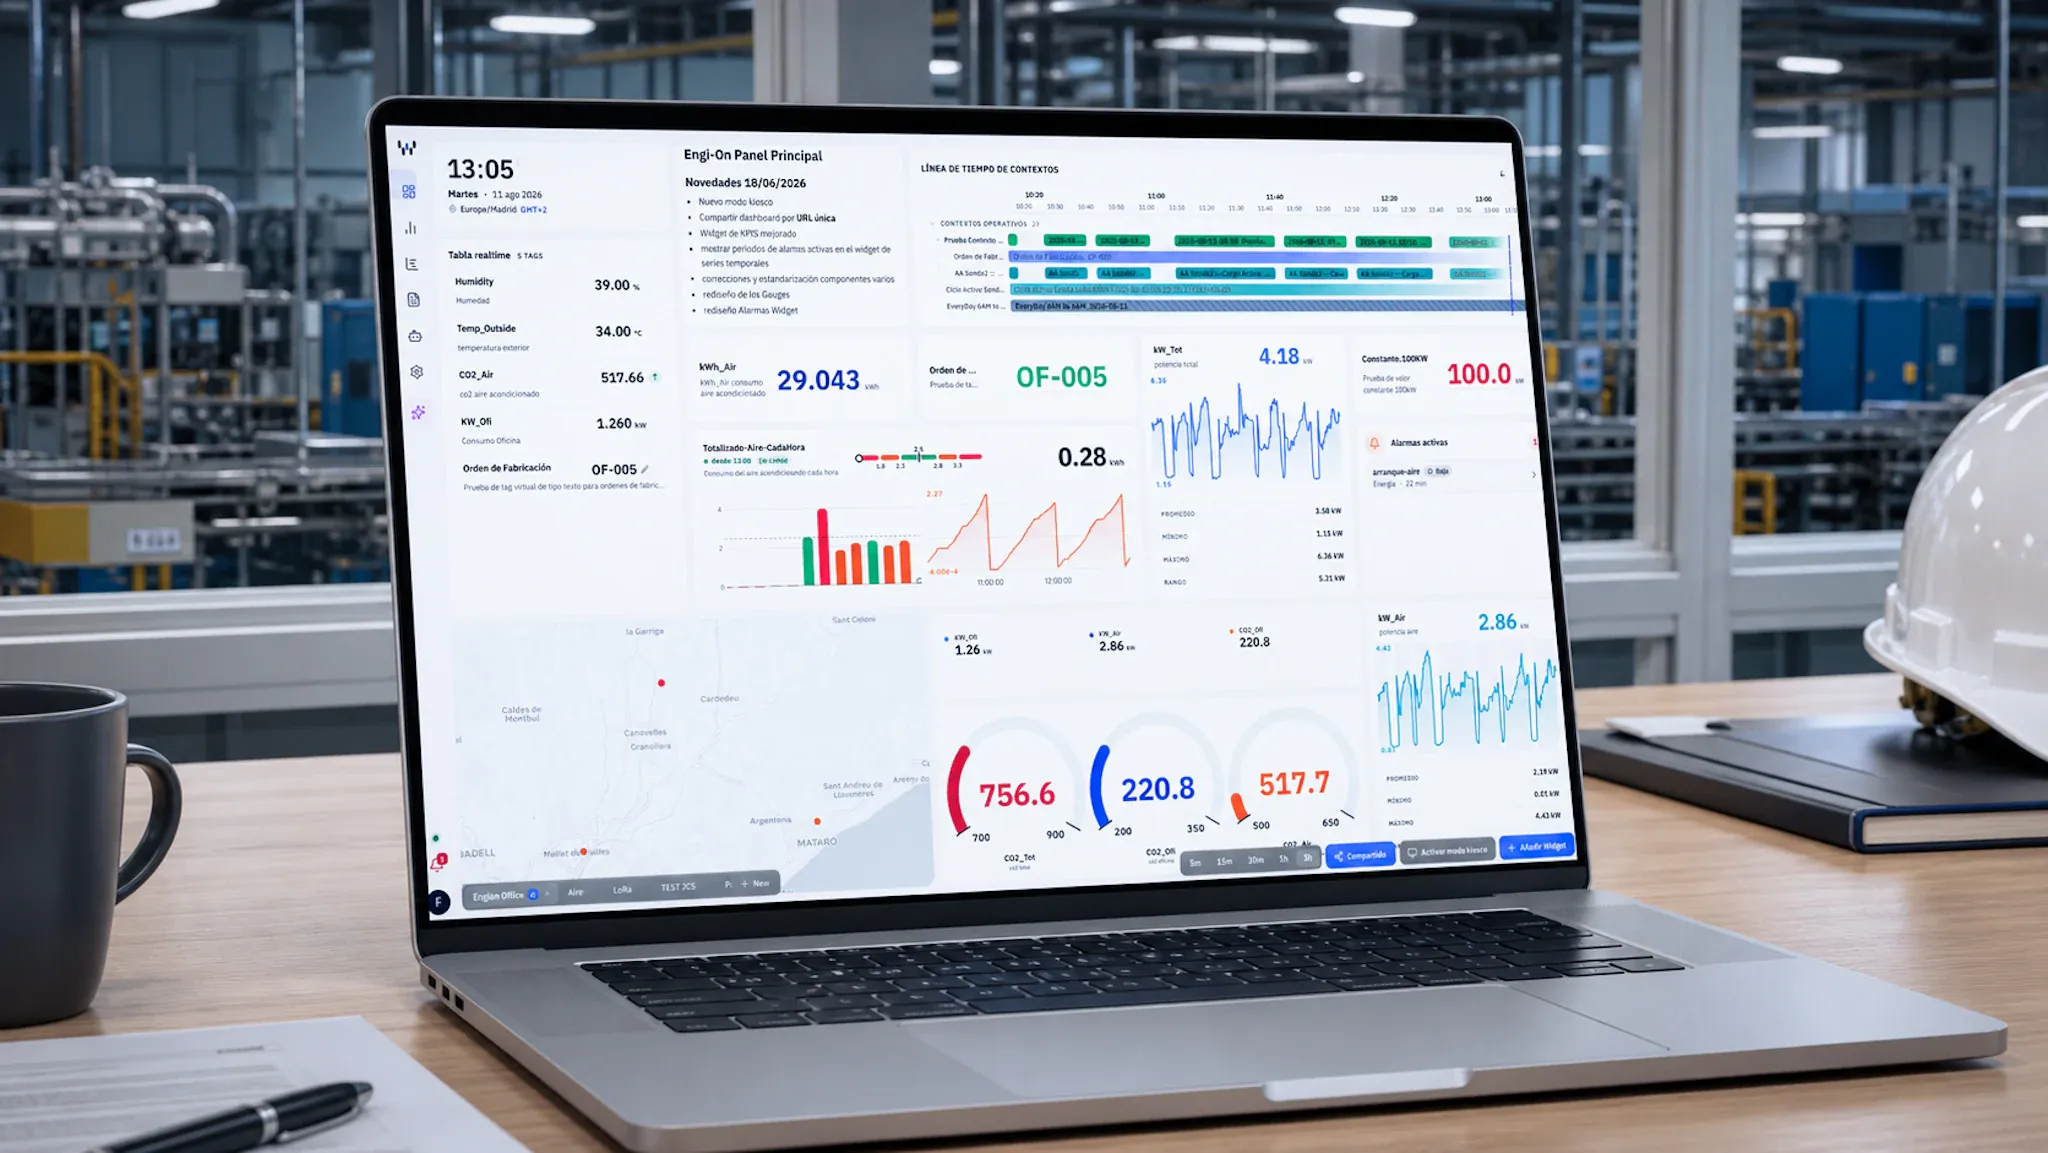
A laptop on a desk with the wattiot Core dashboard open: a table of live values, a timeline of operational contexts, consumption KPIs and active alarms, with the production floor behind it.

The platform

From live data to action

The five views of wattiot Core, in the order you use them.

wattiot · live data
The wattiot real-time dashboard A dashboard you build from widgets: a clock, a list of active alarms, a table of extruder data, three needle gauges for speed, RPM and efficiency, and a live trend chart scrolling under the current-time edge. 11:26 28 Mon · 6 Jul 2026 Europe/Madrid · GMT+2 Active alarms 2 Extruder Speed Critical Quality · 1 min ago B-501 · No signal Medium Equipment · 11 min ago Extruder data 7 tags extrusora_velocidad_ref 110.00 m/min extrusora_rpm_ref 138.00 rpm extrusora_pressure 11.40 bar extrusora_temperature 295.67 °C Speed 135.7 m/min 110 150 RPM 75.3 rpm 70 100 Efficiency 23.4 % 14 24 extrusora_velocidad_live Live 11:2211:2311:2411:2511:26 vel_live135.7 vel_ref110.0 ref −1099.0 ref +10121.0
Speed 135.7 m/min 110 150 RPM 75.3 rpm 70 100 Active alarms 2 Extruder Speed Critical extrusora_velocidad Live 11:2211:2411:26 11:2211:2411:26

The adoption gap2026

Everyone is talking about AI. Almost nobody has the data.

The bottleneck is not the model, it is the data: OT and IT systems sitting apart, fragmented histories, proprietary formats and cloud platforms that do not survive the plant floor.

Exploring AI

98%already exploring or evaluating automation with AI

Ready to deploy

20%consider themselves fully ready to use it at scale

78%

between the two figures above: plants that want AI and still cannot deploy it. That is where wattiot Core comes in.

Redwood Software · Manufacturing AI and Automation Outlook 2026. Global survey of 300 industry professionals. Read the report

AI applied to the plant floor

AI that understands your plant, because the data arrives with context

The assistant understands what you need and creates virtual tags, KPIs, alarms and reports. It answers your questions about the plant on the spot.

How did production go yesterday?

Yesterday Line 3 produced 12,480 units — 4% more than the day before, at 87% OEE. Would you like me to prepare the production report for yesterday?

Yes, create it

Production report

Yesterday · all lines

  • Units produced

    12,480u

    +4% vs previous day

  • OEE

    87%

    Shift target 85%

  • Specific consumption

    0.82kWh/u

  • Output by shift

    Morning
    Afternoon
    Night

Sending the report by email…Sent to [email protected]

Can you forecast energy consumption for the next 2 hours?

At the current load, consumption will reach around 412 kWh by 16:30 — 9% above your usual profile for this shift.

Forecast · Energy consumption

Next 2 h
412 kWh
14:3015:0015:3016:0016:30

Create an alarm if consumption reaches the forecast peak.

Done. I will let you know as soon as consumption reaches 412 kWh.

Alarm · Energy consumption

If consumption ≥ 412 kWh

Active

Audit this month's energy consumption against our baseline model.

Measured consumption is 4% below the baseline model, within ISO 50001 limits. Here is the audit summary.

Energy audit

This month
Measured118.4MWh
Baseline model123.3MWh

Deviation vs model−4.0%

ISO 50001 · Compliant
Ask about your plant…
wattiotnow

Alarm: Energy consumption

412 kWh reached — forecast peak

InteroperabilityComing soon

MCP for agents

Ask about your plant from the agent you already use, whether that is Claude, ChatGPT or Gemini, against your live data, with per-plant permissions and every query logged.

Want to see your data with context?

Book a demo and we will walk the platform on a case close to yours: your KPIs, your shifts, your reports, not a sample dashboard.

Book a demo